The LGTM Stack: Building a Complete Observability Platform with OpenTelemetry, Tempo, Loki, and Grafana on Kubernetes
Metrics alone don’t tell you why your service failed at 2 AM. Logs alone don’t tell you which downstream call made your API slow. Traces alone don’t show you what was written to the database when a request failed. You need all three — and they need to talk to each other.
This post documents the complete observability stack I run on my homelab Kubernetes cluster: OpenTelemetry Collector as the telemetry backbone, Tempo for distributed tracing, Loki for log aggregation, and Grafana as the unified query and visualization layer.
This is not a toy tutorial. This is the actual config I run, and I’ll show you exactly how each piece works and connects to the others.
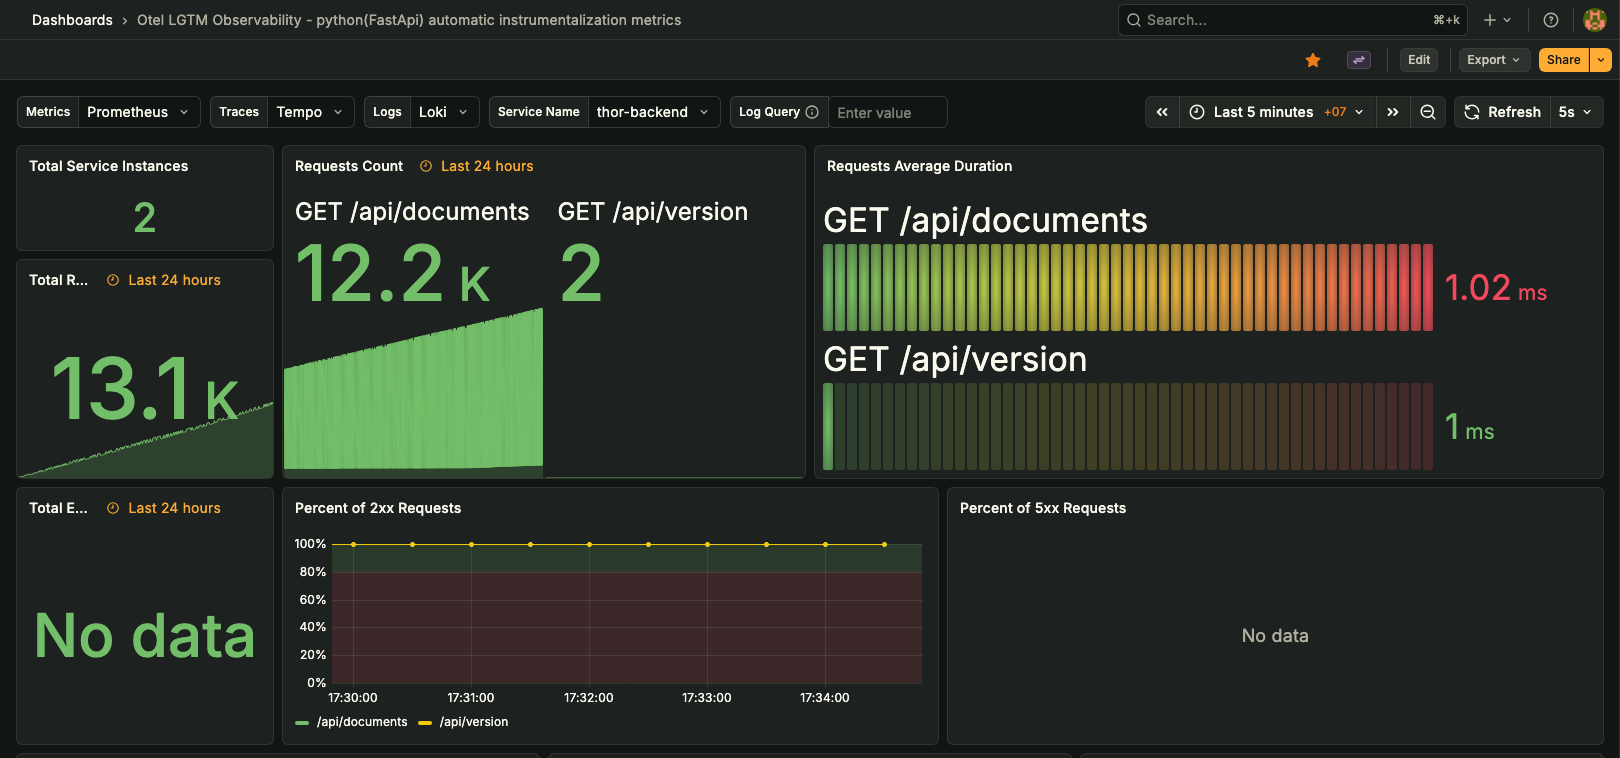
Why This Stack?
The cloud-native observability world converged on a clear model: the three pillars of observability are metrics, logs, and traces. Grafana Labs built open-source tools for each:
| Signal | Tool | Storage |
|---|---|---|
| Metrics | Prometheus / Mimir | Time-series |
| Logs | Loki | Object storage / filesystem |
| Traces | Tempo | Object storage / filesystem |
| Visualization | Grafana | — |
The glue between them is OpenTelemetry (OTEL) — a vendor-neutral, CNCF-standard SDK and collector for instrumenting applications and routing telemetry data.
Running them together gives you something powerful: click a spike in a Grafana dashboard, jump to the traces that happened at that moment, then jump from a trace span directly to the logs from that specific pod at that exact time. That end-to-end correlation is what makes debugging production issues tractable.
Architecture Overview
Here’s how telemetry flows through my cluster:
Application Pods
      │
      │  OTLP (gRPC :4317 or HTTP :4318)
      ▼
┌─────────────────────────────────┐
│       OpenTelemetry Collector    │
│  ┌──────────┐  ┌─────────────┐  │
│  │ Receivers│  │  Processors │  │
│  │  - OTLP  │─▶│  - batch    │  │
│  │          │  │  - memory   │  │
│  └──────────┘  └─────────────┘  │
│                      │          │
│              ┌───────┼───────┐  │
│              ▼       ▼       ▼  │
│           Traces  Metrics  Logs │
└──────────────┼──────┼───────────┘
               │      │       │
               ▼      ▼       ▼
            Tempo  Prometheus  (Loki via Promtail)
               │      │       │
               └──────┴───────┘
                       │
                    Grafana
Promtail runs as a DaemonSet and scrapes container logs from the Kubernetes node filesystem, shipping them directly to Loki. The OTEL Collector handles traces and metrics from instrumented applications.
The OpenTelemetry Collector
OpenTelemetry Collector is a vendor-agnostic proxy for telemetry data. You configure it as a pipeline: receivers → processors → exporters.
My cluster runs the opentelemetry-operator, which manages OpenTelemetryCollector CRDs and handles the deployment lifecycle. The collector itself runs as a Deployment (not a DaemonSet) since it’s handling push-based telemetry, not node-level scraping.
Collector Version and Image
ghcr.io/open-telemetry/opentelemetry-collector-releases/opentelemetry-collector-contrib:0.148.0
The -contrib image includes exporters for Tempo, Loki, Prometheus remote write, and hundreds of other backends. The core image is minimal.
The Full Pipeline Config
receivers:
  otlp:
    protocols:
      grpc:
        endpoint: 0.0.0.0:4317
      http:
        endpoint: 0.0.0.0:4318

processors:
  batch:
    send_batch_size: 1024
    timeout: 5s
  memory_limiter:
    check_interval: 1s
    limit_percentage: 75
    spike_limit_percentage: 15

exporters:
  debug:
    verbosity: basic
  otlp_grpc/tempo:
    endpoint: http://tempo.monitoring:4317
    tls:
      insecure: true
  prometheusremotewrite:
    endpoint: http://kube-prometheus-stack-prometheus.monitoring:9090/api/v1/write
    resource_to_telemetry_conversion:
      enabled: true
    tls:
      insecure: true

service:
  telemetry:
    metrics:
      readers:
        - pull:
            exporter:
              prometheus:
                host: 0.0.0.0
                port: 8888
  pipelines:
    traces:
      receivers: [otlp]
      processors: [memory_limiter, batch]
      exporters: [otlp_grpc/tempo]
    metrics:
      receivers: [otlp]
      processors: [memory_limiter, batch]
      exporters: [prometheusremotewrite]
    logs:
      receivers: [otlp]
      processors: [memory_limiter, batch]
      exporters: [debug]
A few things worth noting:
memory_limiter comes before batch in the processor chain. This is important — the memory limiter needs to see data early before the batcher accumulates it all in memory. If you reverse the order, you can hit OOM spikes on traffic bursts.
resource_to_telemetry_conversion: enabled: true in the Prometheus remote write exporter converts OTEL resource attributes (like service.name, k8s.pod.name) into Prometheus labels. Without this, you lose the service-level metadata that makes metrics useful.
The collector exposes its own metrics on port 8888 via a Prometheus pull endpoint. This means you get collector health metrics (receiver accepted spans, exporter send failures, memory usage) in Prometheus for free.
Logs currently go to debug exporter only. This is intentional for now — Promtail handles log collection from the node filesystem, which is simpler and more complete than requiring all apps to emit OTLP logs. The OTLP log pipeline is there for structured application logs from services that emit them directly.
Sending Data to the Collector
Any application instrumented with an OTEL SDK can send to the collector. Set these environment variables in your pod:
env:
  - name: OTEL_EXPORTER_OTLP_ENDPOINT
    value: "http://otel-collector.monitoring:4318"
  - name: OTEL_SERVICE_NAME
    value: "my-service"
  - name: OTEL_RESOURCE_ATTRIBUTES
    value: "deployment.environment=production,k8s.namespace.name=apps"
Use port 4317 for gRPC (preferred for performance), 4318 for HTTP. The HTTP endpoint is easier to use from environments that don’t support gRPC well (e.g., some serverless runtimes or browser-side tracing).
Tempo: Distributed Tracing Backend
Tempo is Grafana Labs’ distributed tracing backend. It ingests traces in multiple formats (OTLP, Jaeger, Zipkin, OpenCensus) and stores them as flat objects indexed by trace ID. Queries are purely by trace ID — Tempo does not have a traditional inverted index, which makes it extremely storage-efficient.
Version and Helm Chart
app version: 2.9.0
helm chart:  tempo-1.24.4
Configuration
memberlist:
  cluster_label: "tempo.monitoring"

multitenancy_enabled: false

compactor:
  compaction:
    block_retention: 24h

distributor:
  receivers:
    jaeger:
      protocols:
        grpc:
          endpoint: 0.0.0.0:14250
        thrift_binary:
          endpoint: 0.0.0.0:6832
        thrift_compact:
          endpoint: 0.0.0.0:6831
        thrift_http:
          endpoint: 0.0.0.0:14268
    opencensus: null
    otlp:
      protocols:
        grpc:
          endpoint: 0.0.0.0:4317
        http:
          endpoint: 0.0.0.0:4318

ingester:
  max_block_bytes: 1000000
  max_block_duration: 5m
  trace_idle_period: 10s

server:
  http_listen_port: 3200

storage:
  trace:
    backend: local
    local:
      path: /var/tempo/traces
    wal:
      path: /var/tempo/wal

overrides:
  defaults: {}
  per_tenant_override_config: /conf/overrides.yaml
How Tempo Works
Tempo has three main components in a monolithic deployment (what I run):
- Distributor — receives spans from all sources, batches them, and routes them to ingesters by trace ID (using consistent hashing)
- Ingester — keeps recent traces in memory and WAL, flushes to object storage when a block is complete
- Querier — searches both the object store and in-memory ingester data for a given trace ID
The WAL (Write-Ahead Log) means traces survive a crash — on startup, the ingester replays the WAL before accepting new data.
Block retention is set to 24h here (homelab storage is limited). In production, you’d typically set this to 7–30 days and use object storage (S3, GCS) instead of local disk.
Why Jaeger Receivers Are Enabled
Tempo accepts Jaeger formats even though OTEL is the standard now. This matters if you have older services already instrumented with the Jaeger client SDK — you can route them directly to Tempo without modifying the application. The OTEL Collector also has a Jaeger receiver, so you can do this translation there instead if you prefer a single ingestion point.
The Ingester Tuning
ingester:
  max_block_bytes: 1000000    # ~1MB blocks
  max_block_duration: 5m      # flush at least every 5 minutes
  trace_idle_period: 10s      # idle traces are closed after 10s
The trace_idle_period is the most important setting for query latency. A trace is “idle” when no new spans for it have arrived in this period. Setting it too high delays when traces become queryable; setting it too low may split long-running traces across blocks. 10s is a good default for services with request durations under a few seconds.
Loki: Log Aggregation
Loki is Prometheus for logs. Instead of indexing the full log content (like Elasticsearch), it only indexes the labels attached to log streams, and stores the log content as compressed chunks. This makes Loki drastically cheaper to run — you store and query terabytes of logs with a fraction of the resources Elasticsearch needs.
Version and Helm Chart
app version: 3.6.7
helm chart:  loki-6.55.0
Configuration
auth_enabled: false

common:
  compactor_grpc_address: 'loki.monitoring.svc.cluster.local:9095'
  path_prefix: /var/loki
  replication_factor: 1
  storage:
    filesystem:
      chunks_directory: /var/loki/chunks
      rules_directory: /var/loki/rules

limits_config:
  max_cache_freshness_per_query: 10m
  query_timeout: 300s
  reject_old_samples: true
  reject_old_samples_max_age: 720h      # 30 days
  split_queries_by_interval: 15m
  volume_enabled: true

schema_config:
  configs:
    - from: "2024-01-01"
      index:
        period: 24h
        prefix: loki_index_
      object_store: filesystem
      schema: v13
      store: tsdb

server:
  grpc_listen_port: 9095
  http_listen_port: 3100
  http_server_read_timeout: 600s
  http_server_write_timeout: 600s
Schema v13 and TSDB
The schema: v13 with store: tsdb is the latest Loki storage format (as of Loki 3.x). TSDB (Time-Series Database format) for the index is significantly more efficient than the older BoltDB shipper — it compresses better, queries faster, and handles high cardinality labels more gracefully.
Never mix schemas. If you need to upgrade from an older schema, add a new config entry with a future from date. Loki reads old chunks with the old schema and new chunks with the new one, transparently.
Reject Old Samples
reject_old_samples: true
reject_old_samples_max_age: 720h
This rejects log lines with timestamps older than 30 days. This prevents accidental backfill of old logs that would bloat the index and violate the chunk ordering invariant. If you’re doing log migration from an old system, disable this temporarily.
Volume Queries
volume_enabled: true
This enables Loki’s log volume API — it answers “how many log lines are there per label value?” without fetching the actual log content. Grafana uses this for the log volume histogram shown above the log panel in Explore mode.
Promtail: Log Collection
Promtail is the log shipper that runs as a DaemonSet. It reads /var/log/pods/ on each node and attaches Kubernetes labels:
# My promtail config
server:
  http_listen_port: 9080

clients:
  - url: http://loki.monitoring:3100/loki/api/v1/push

scrape_configs:
  - job_name: kubernetes-pods
    kubernetes_sd_configs:
      - role: pod
    pipeline_stages:
      - cri: {}
    relabel_configs:
      - source_labels: [__meta_kubernetes_pod_label_app]
        target_label: app
      - source_labels: [__meta_kubernetes_namespace]
        target_label: namespace
      - source_labels: [__meta_kubernetes_pod_name]
        target_label: pod
      - source_labels: [__meta_kubernetes_container_name]
        target_label: container
The cri: {} pipeline stage parses the CRI (Container Runtime Interface) log format — the time level message prefix that containerd adds to every log line before the actual application output.
LogQL: Querying Logs
Loki uses LogQL, which has two query types:
Log queries — return raw log lines:
{namespace="apps", app="my-service"} |= "error"
Metric queries — aggregate log data into time-series:
rate({namespace="apps"} |= "error" [5m])
LogQL supports log parsing with | json, | logfmt, | pattern, and | regex stages that extract structured fields from log content for filtering:
{app="my-service"}
  | json
  | level="error"
  | traceID != ""
Grafana: Unified Visualization
Grafana is the single pane of glass for all three data sources. I use kube-prometheus-stack which bundles Grafana with Prometheus, and then add Loki and Tempo as additional datasources via ConfigMaps.
Datasource Configuration
Datasources are provisioned via labeled ConfigMaps that the Grafana sidecar picks up automatically:
Loki Datasource:
apiVersion: v1
kind: ConfigMap
metadata:
  name: grafana-loki-datasource
  labels:
    grafana_datasource: "1"   # this label triggers the sidecar
data:
  loki-datasource.yaml: |
    apiVersion: 1
    datasources:
      - name: Loki
        type: loki
        uid: loki
        url: http://loki.monitoring:3100
        access: proxy
        isDefault: false
        jsonData:
          derivedFields:
            - datasourceUid: tempo
              matcherRegex: '"traceID":"(\w+)"'
              name: TraceID
              url: "${__value.raw}"
Tempo Datasource:
apiVersion: v1
kind: ConfigMap
metadata:
  name: grafana-tempo-datasource
  labels:
    grafana_datasource: "1"
data:
  tempo-datasource.yaml: |
    apiVersion: 1
    datasources:
      - name: Tempo
        type: tempo
        uid: tempo
        url: http://tempo.monitoring:3200
        access: proxy
        isDefault: false
        jsonData:
          nodeGraph:
            enabled: true
          serviceMap:
            datasourceUid: prometheus
          grpcEndpoint: ""
          streamingEnabled: false
The Critical Link: Derived Fields
The derivedFields configuration in the Loki datasource is what enables trace-log correlation. When Grafana renders a log line in Explore, it scans the raw text with the regex "traceID":"(\w+)". If it finds a match, it renders the captured value as a clickable link that jumps to the matching trace in Tempo.
This means your application logs must include a traceID field in the structured JSON output. With OTEL SDKs, this happens automatically when you use the SDK’s logging integration — the active trace context gets injected into every log record.
For example, a Go service using go.opentelemetry.io/otel with slog bridge would emit:
{
  "time": "2026-04-04T07:23:11Z",
  "level": "INFO",
  "msg": "request completed",
  "traceID": "4bf92f3577b34da6a3ce929d0e0e4736",
  "spanID": "00f067aa0ba902b7",
  "duration_ms": 124,
  "status": 200
}
Grafana sees the traceID field, renders a “TraceID” link button next to the log line, and clicking it opens the full trace in Tempo — without you writing a single line of query.
Tempo Service Map
serviceMap:
  datasourceUid: prometheus
Tempo’s service map feature uses Exemplars stored in Prometheus. When a trace is sampled, Tempo extracts the span relationships and writes them as Prometheus metrics (request counts, error rates, latency histograms) labeled by client and server service names. The service map in Grafana reads these metrics and renders an interactive graph showing how your services call each other.
This requires Prometheus to have exemplar storage enabled:
# kube-prometheus-stack values
prometheus:
  prometheusSpec:
    enableFeatures:
      - exemplar-storage
Node Graph for Traces
nodeGraph:
  enabled: true
When you open a trace in Grafana’s Tempo viewer, the Node Graph panel renders the trace as a DAG where each span is a node. You can see parallelism, sequential calls, and where time is actually spent — much more readable than a Gantt chart for complex traces with hundreds of spans.
Putting It All Together: A Real Debugging Flow
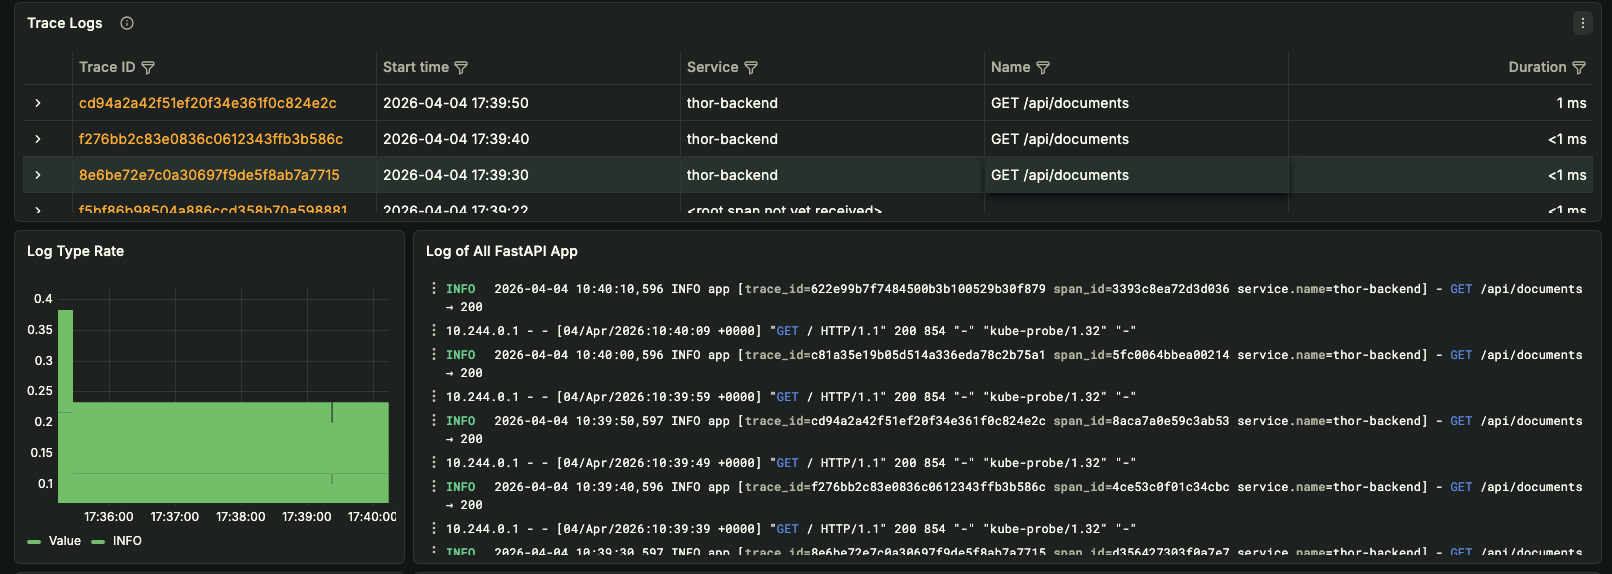
Here’s how I actually use this stack when something goes wrong.
Scenario: API response times spike for 3 minutes, then recover. No alerts fire (threshold wasn’t crossed). I find out from a user report the next morning.
Step 1: Grafana → Metrics
Open the API latency dashboard. I can see the p99 spike from 180ms to 2.4s between 14:32 and 14:35. The spike is isolated to one endpoint: POST /api/upload.
Step 2: Exemplars → Traces
Click the spike on the latency histogram panel. Grafana renders the exemplar dots — individual trace IDs stored alongside the metric point. Click one of the high-latency exemplar dots. Grafana jumps to that trace in Tempo.
Step 3: Tempo → Trace Analysis
The trace shows a 2.4s request that spent 2.1s in a span called pgvector.similarity_search. The span has attributes: db.statement (the query) and db.rows_returned: 0. The query was doing a full table scan because the vector index was missing on the new column added in the deployment that morning.
Step 4: Loki → Correlated Logs
The Tempo span has a traceID. I click the “Logs for this trace” link (or use the derived fields from the Loki datasource). Grafana filters to log lines containing that exact trace ID. I see a stack of WARN pgvector: index miss log lines — the application was logging this but it wasn’t connected to the metric spike until now.
Root cause identified in 4 minutes. Without correlated observability, this would have been a two-hour investigation comparing timestamps across separate systems.
Things I’d Change for Production
My homelab setup makes some pragmatic trade-offs that you shouldn’t replicate in production:
Storage: I use local filesystem for both Loki and Tempo. In production, use S3-compatible object storage (MinIO on-prem or AWS S3). Local storage doesn’t survive node failures and makes scaling impossible.
Retention: 24h block retention in Tempo and 30-day rejection limit in Loki are homelab settings. Production typically needs 7–90 days depending on compliance requirements.
Replication: replication_factor: 1 for Loki means a single pod failure loses in-flight logs. Production should use at least 2, ideally 3.
Sampling: Without sampling, every request generates a trace. At high traffic (thousands of req/s), this creates serious storage pressure. Use tail-based sampling in the OTEL Collector to keep 100% of error traces and sample down slow and fast successful traces.
# Add to OTEL collector config
processors:
  tail_sampling:
    decision_wait: 10s
    policies:
      - name: errors-policy
        type: status_code
        status_code: { status_codes: [ERROR] }
      - name: slow-traces-policy
        type: latency
        latency: { threshold_ms: 500 }
      - name: default-policy
        type: probabilistic
        probabilistic: { sampling_percentage: 10 }
OTEL Collector as DaemonSet: For high-traffic clusters, run the collector as a DaemonSet so each node has a local collector. This avoids cross-node network hops for telemetry and provides isolation — a noisy application on one node can’t overwhelm the collector for the whole cluster.
Conclusion
The OTEL → Tempo / Loki → Grafana stack is the most practical full-stack observability platform I’ve run. The components are independently scalable, the storage costs are predictable, and the correlated debugging experience is genuinely better than what I’ve seen from commercial APM tools.
The key insight is that correlation is the product. Metrics, logs, and traces are only useful together. The traceID in logs linking to Tempo, and exemplars in Prometheus linking to traces, are what transform three separate datasets into a coherent debugging experience.
Everything in this post is running in production on my homelab Kubernetes cluster. If you’re setting up something similar, the configs above are what actually work.